Google recently released updates to it’s Sheets/Slides/Docs products, called Explore.
In their blog post they say:
Today’s updates to Explore in Sheets help you decipher your data easily, whether you’re new to spreadsheets or a formula pro. Just ask Explore — with words, not formulas — to get answers about your data. You can ask questions like “how many units were sold on Black Friday?,” “what are the top three items by sales price?,” or “what was the total cost of jackets last month?” Less time crunching numbers + crafting formulas = more time to find key insights and use them.

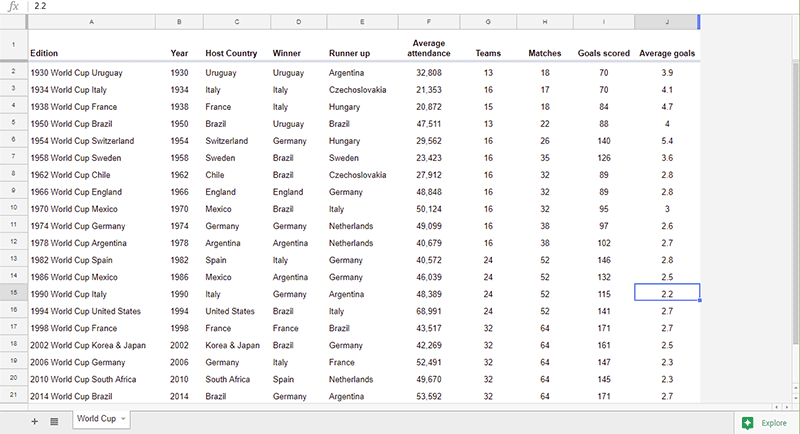
The feature is available at the bottom right of each Sheet, for this post I’ll use the demo content related to the FIFA World Cup and some statistics and records.

You can see in the bottom right a new link, “Explore".

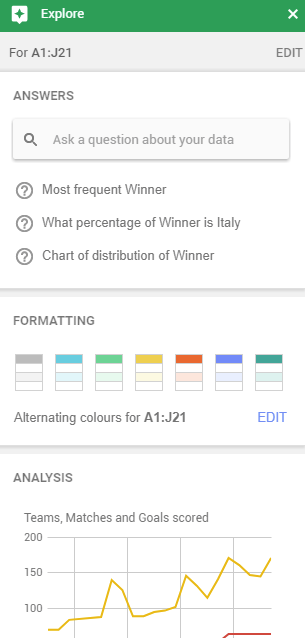
The really interesting thing happens when you click this to launch the Explore area. When it launches you will see suggested questions (i.e. Most frequent winner?) as well as suggested formatting options and a number of predefined charts based on the data identified by the Google Sheets product.

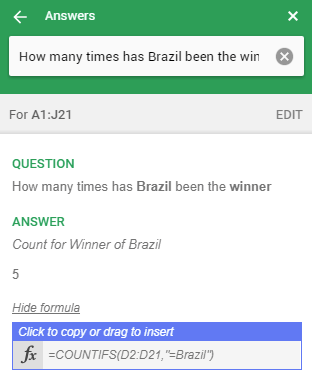
You can also type your own question in natural language to perform queries, the result is shown and you can also view the formula used to determine the answer, pretty cool!

If you highlight a group of cells, once Explore is clicked you can then select the formatting you prefer best under the formatting section. Explore creates on-the-fly charts based on the data you’ve selected. Click and drag the chart onto your document, it is that easy.
Explore is not restricted to Sheets, it also works with Slides where designs are suggested based on your content. With Docs you get instant suggestions based on your content, a fantastic research tool.
I’m sure Google will be adding even richer functionality to this offering, stay tuned.